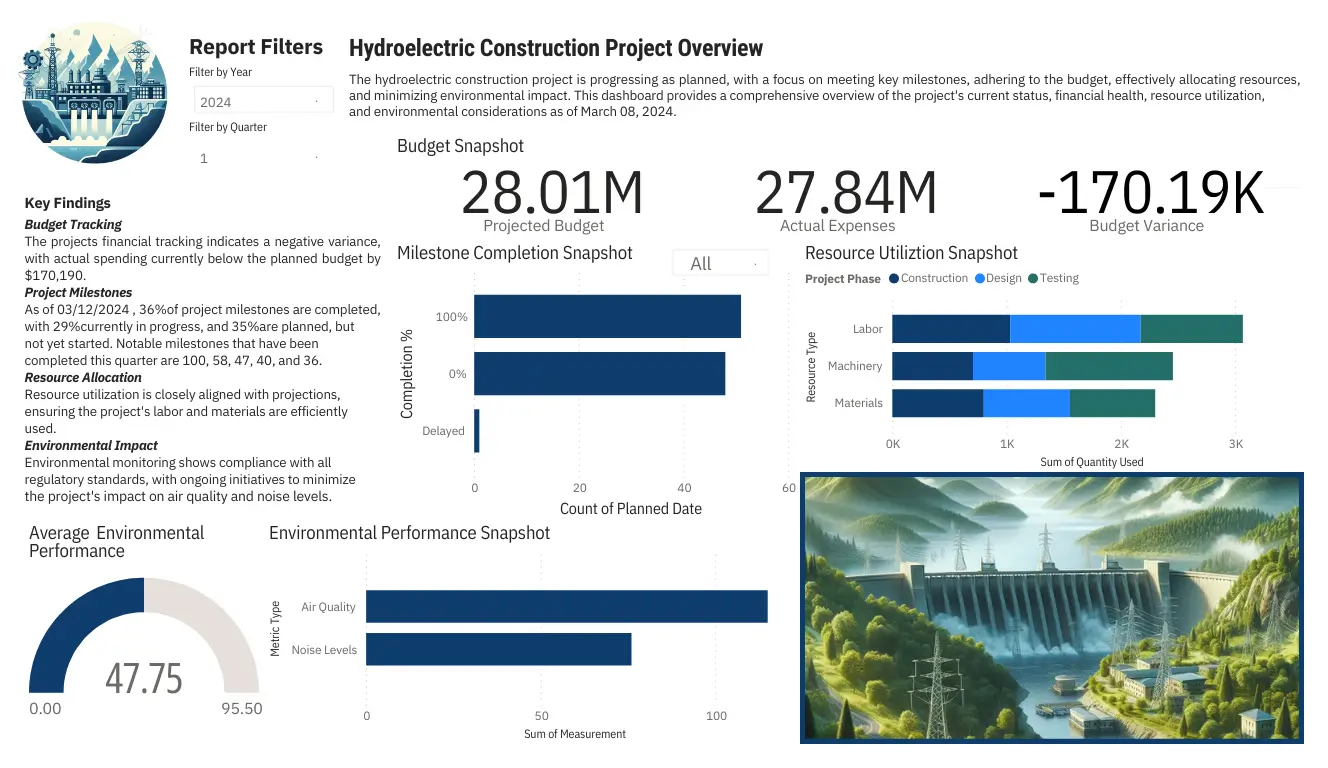
Hydroelectric Construction Project Dashboard (Demonstration)
This project demonstrates how Power BI analytics can transform sustainable energy reporting.
case-study
data-visualization
sustainability
Discover how I transform complex challenges into strategic solutions through data-driven insights, process optimization, and innovative problem-solving approaches. Each project demonstrates my commitment to creating meaningful impact through analytical thinking and strategic implementation.
Operational reporting systems designed for continuous organizational monitoring.
This project demonstrates how Power BI analytics can transform sustainable energy reporting.
In-depth analysis of real-world challenges and the strategic solutions implemented to address them.
A reflective case study on building and migrating a decentralized storytelling website from Fleek to Cloudflare, revealing lessons learned from Web3 …
A multi-year transformation initiative that migrated a retail organization from an unstable flat database to a scalable PostgreSQL solution, …
Custom analytics solutions, reporting dashboards, and data-driven insights that enable better decision-making.
A regression analysis exploring how age predicts income using SAS. Demonstrates statistical reasoning, model validation, and data storytelling through …
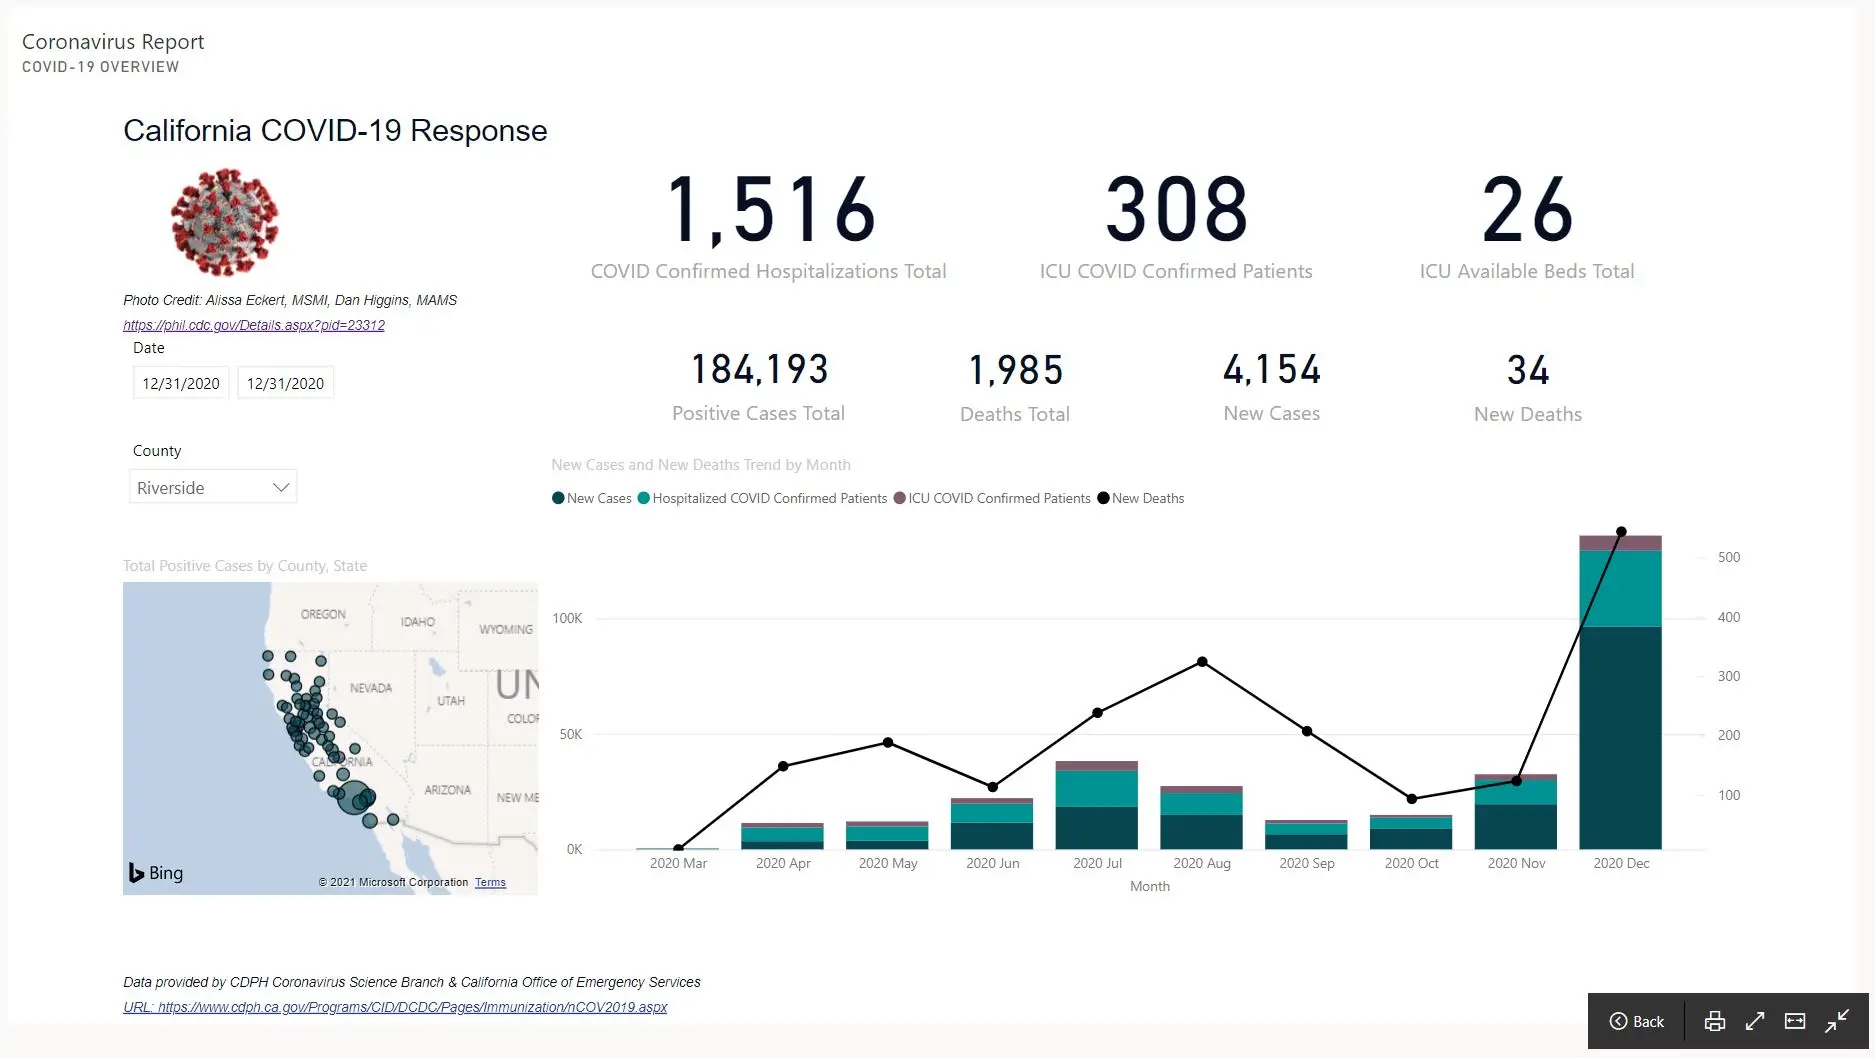
This project demonstrates how Power BI can improve data accessibility and supporting rapid public health decision-making.
Interested in collaborating? I'd love to discuss your project needs.
Start a Conversation