Hydroelectric Construction Project Dashboard (Demonstration)
Demonstration case study: Hydroelectric Construction Project — how data visualization and performance metrics could transform project oversight in the energy sector.
Project Overview
This project was developed as a demonstration dashboard to showcase how structured data modeling and optimized Power BI workflows can improve transparency and decision-making in large-scale sustainability projects.
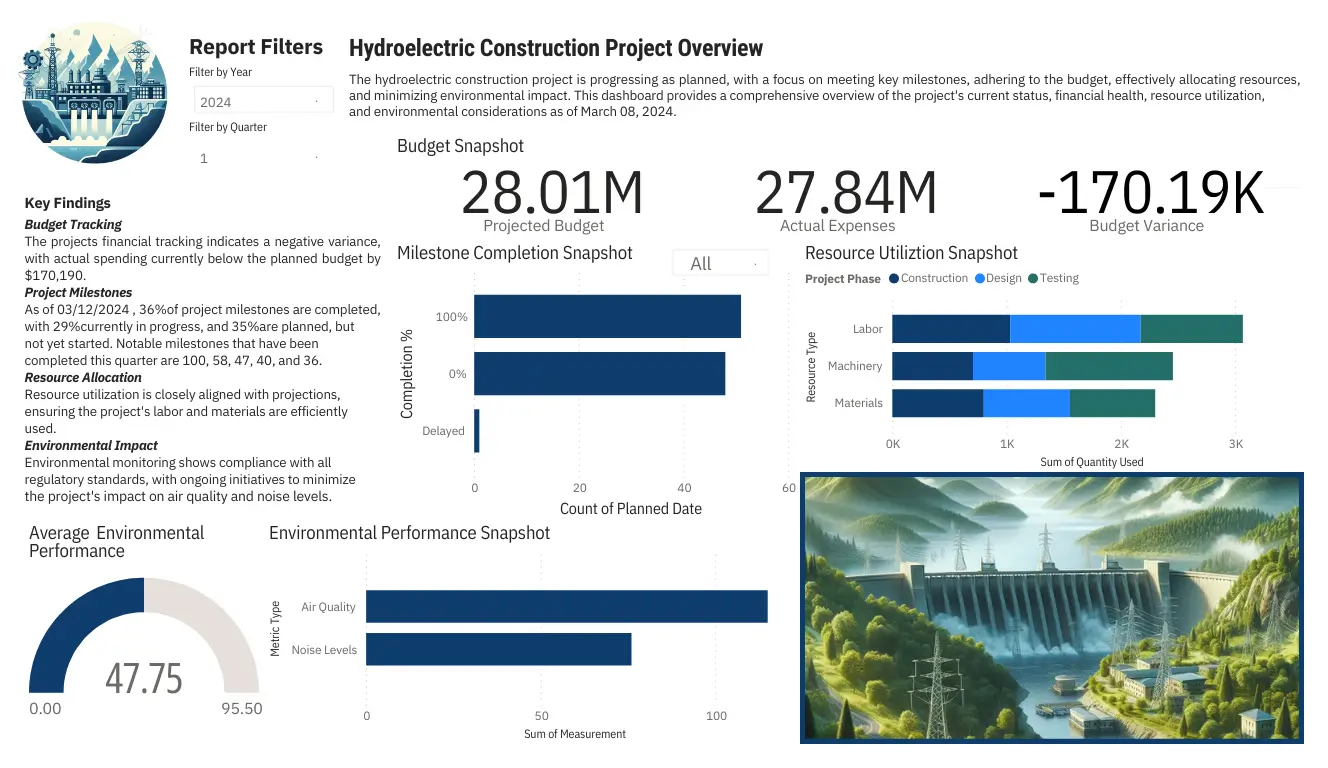
The concept simulates a hydroelectric construction project, illustrating how executive teams could track budget performance, milestone completion, resource allocation, and environmental compliance through one cohesive visual platform.
Though independently created, this prototype reflects the same business logic, precision, and communication style I bring to professional client work.
Challenge
Energy infrastructure projects often face complex reporting demands, with fragmented datasets spread across departments.
The primary objective of this demonstration was to design a unified model showing how executives could monitor:
- Budget adherence and financial variance
- Project milestone completion rates
- Resource utilization and workforce allocation
- Environmental impact compliance metrics
The challenge was to integrate these metrics seamlessly and make them actionable through data visualization.
Solution
I designed a data model and accompanying Power BI dashboard to simulate real-world reporting for a hydroelectric project.
Using self-developed sample data, I replicated how different business systems — finance, HR, and environmental monitoring — could interact in a consolidated analytics environment.
Key highlights include:
- Budget Variance Calculations comparing planned vs. actual expenditures by phase.
- Resource Utilization Metrics quantifying workforce and equipment usage.
- Environmental Compliance Scoring with an aggregate impact index across air, water, and habitat metrics.
- Executive Overview Dashboards summarizing milestones, risks, and performance indicators in near real-time.
Impact
While this project was not client-commissioned, it effectively demonstrates my capacity to design, document, and deliver enterprise-grade analytics independently.
The result is a cohesive, visually appealing dashboard that models:
- Transparent reporting and accountability
- Data-driven performance tracking
- Sustainable project oversight through quantifiable impact metrics
This demonstration also became a valuable reference when discussing future collaborations with energy and sustainability-focused organizations.
Process
1. Discovery & Analysis
- Researched hydroelectric project structures and reporting frameworks.
- Designed the data schema around milestones, budgets, and environmental impact factors.
- Drafted business logic documentation detailing formulas, metrics, and relationships.
2. Implementation
- Built the dashboard using Power BI with Power Query for ETL and transformation logic.
- Defined DAX measures for performance metrics such as Budget Variance and Resource Utilization.
- Applied relational modeling and filters to ensure interactivity across visuals.
- Incorporated indexing and caching methods to simulate performance optimization at scale.
3. Results & Optimization
- Implemented pagination and performance tuning for large datasets.
- Structured visuals for consistency across categories (Finance, Milestones, Environment).
- Simulated real-time updates for ongoing reporting refinement and stakeholder review.
Key Deliverables
- Dashboard / Visualization: A fully functional Power BI report visualizing milestones, budget status, and environmental metrics.
- Process Automation: Parameterized refresh system and Power Query logic for scheduled data updates.
- Documentation: Detailed business logic and data relationship mapping, optimized for executive use.
Lessons Learned
- Demonstration projects can be powerful credibility tools — they show what’s possible when given creative freedom.
- Consistent data storytelling helps non-technical stakeholders engage with complex information.
- Optimization principles (indexing, caching, pagination) make even simulated data behave like production-ready systems.
Technical Details
For demonstration purposes, here’s an example of one of the key metrics:
| |