Telco Regression Model
Case study: Using regression analysis to explore how age predicts income in Telco data, highlighting statistical insights and business relevance.

Project Overview
This project was developed as part of my statistics coursework at Colorado State University Global, where I built a linear regression model to analyze how age predicts income within a Telco dataset. The goal was to understand and interpret statistical relationships through visualization and model evaluation using SAS. It demonstrates my analytical skill set, technical fluency, and ability to communicate data-driven findings through clear visuals and narrative.
Challenge
The challenge was to determine whether age could serve as a significant predictor of income within a sample of 1,000 Telco customers. This required assessing linear relationships, identifying outliers, and validating regression assumptions.
Key questions included:
- Is there a measurable correlation between age and income?
- How well does a simple linear regression model explain the data?
- What insights can this model provide about income trends over age?
Solution
Using SAS, I:
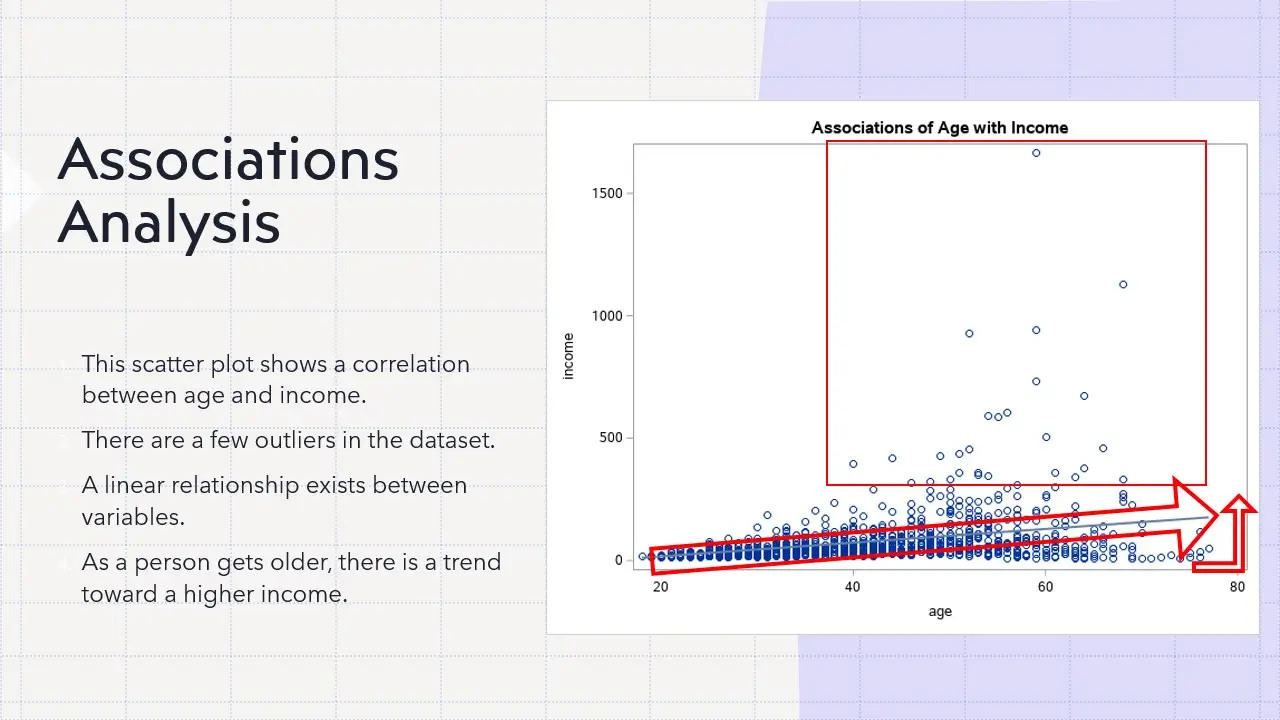
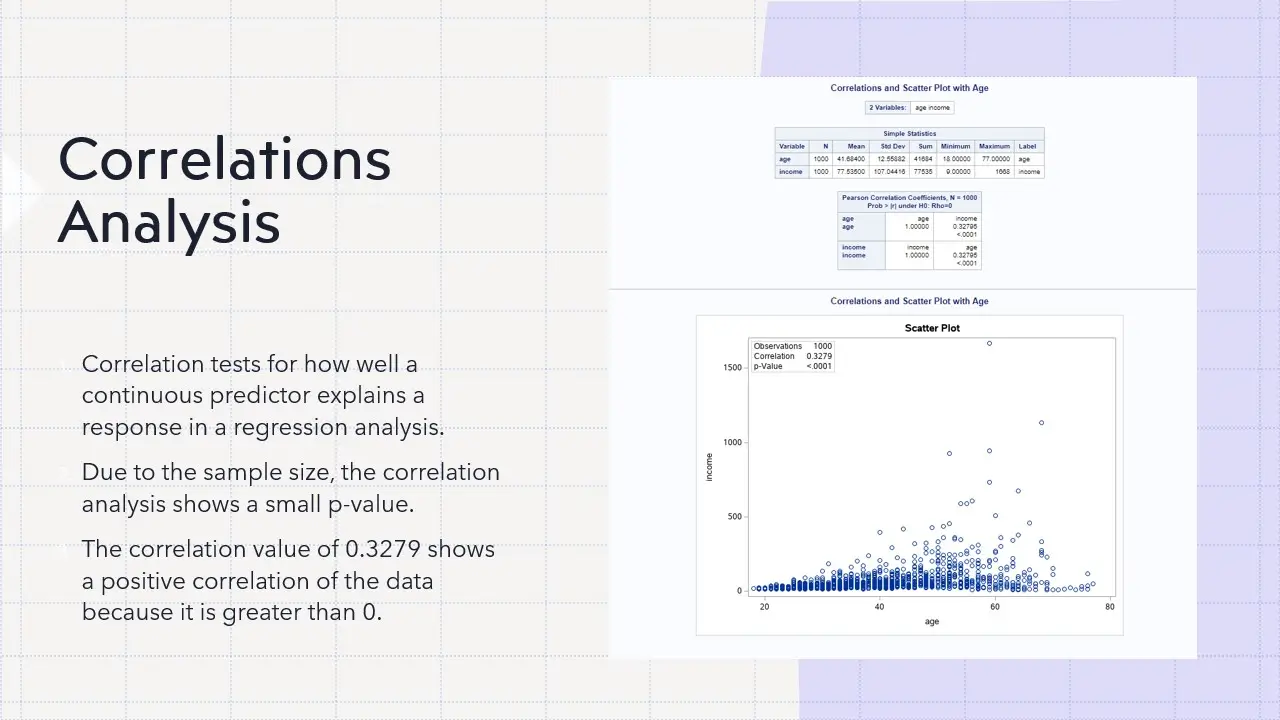
- Conducted correlation and association analysis to quantify the strength of the relationship between age and income.
- Built a simple linear regression model to estimate income based on age.
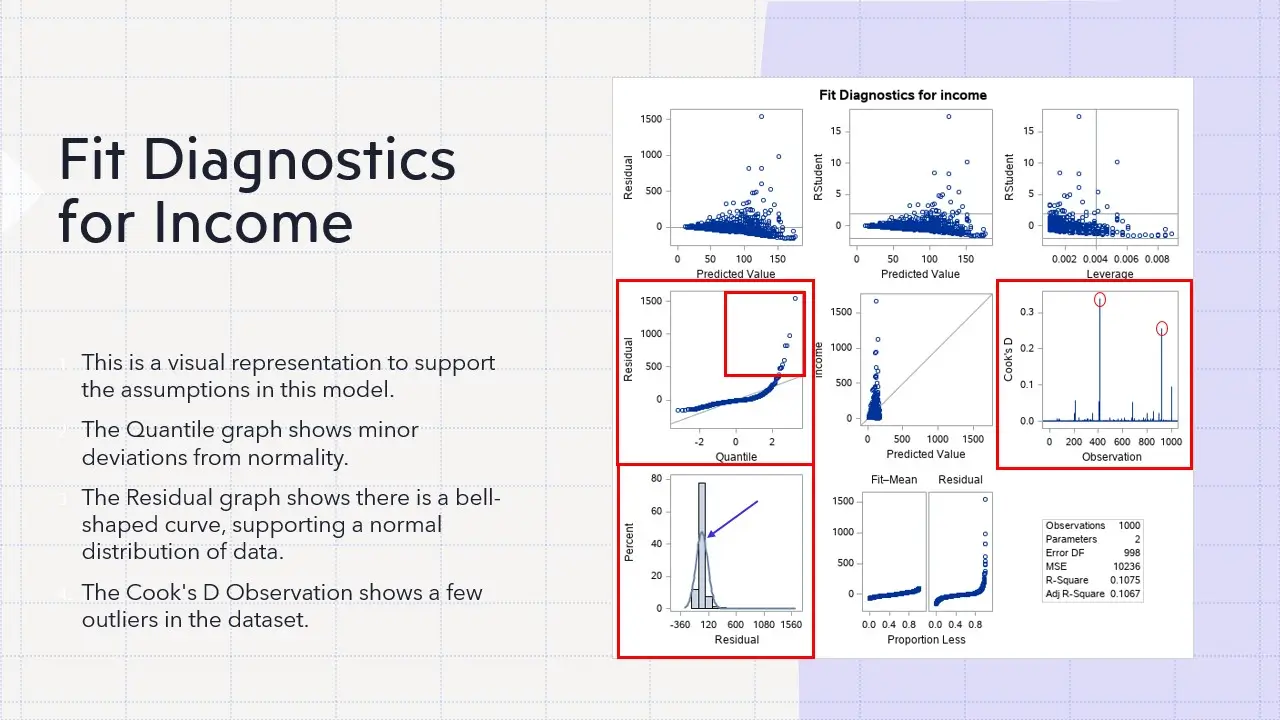
- Evaluated model fit using R-squared, residual, and diagnostic plots.
- Interpreted findings in terms of business and social implications.
Impact
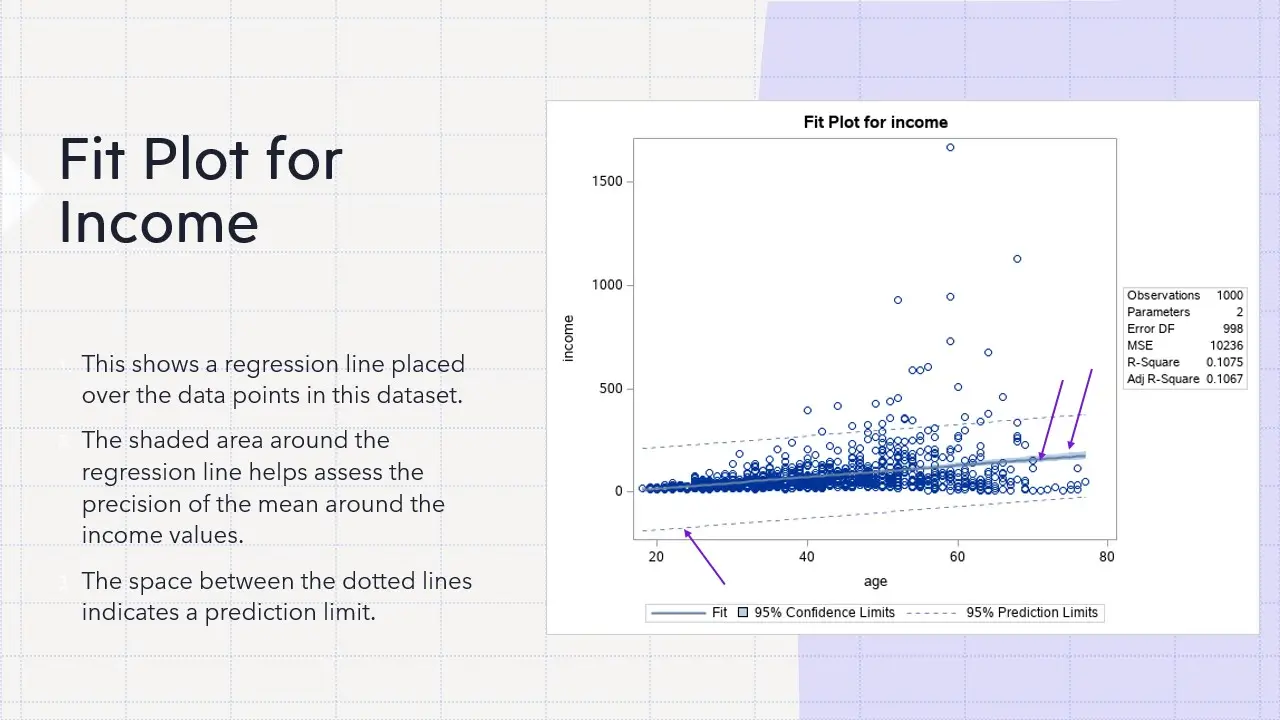
The analysis revealed a positive correlation (r = 0.3279) between age and income, indicating that income tends to increase with age.
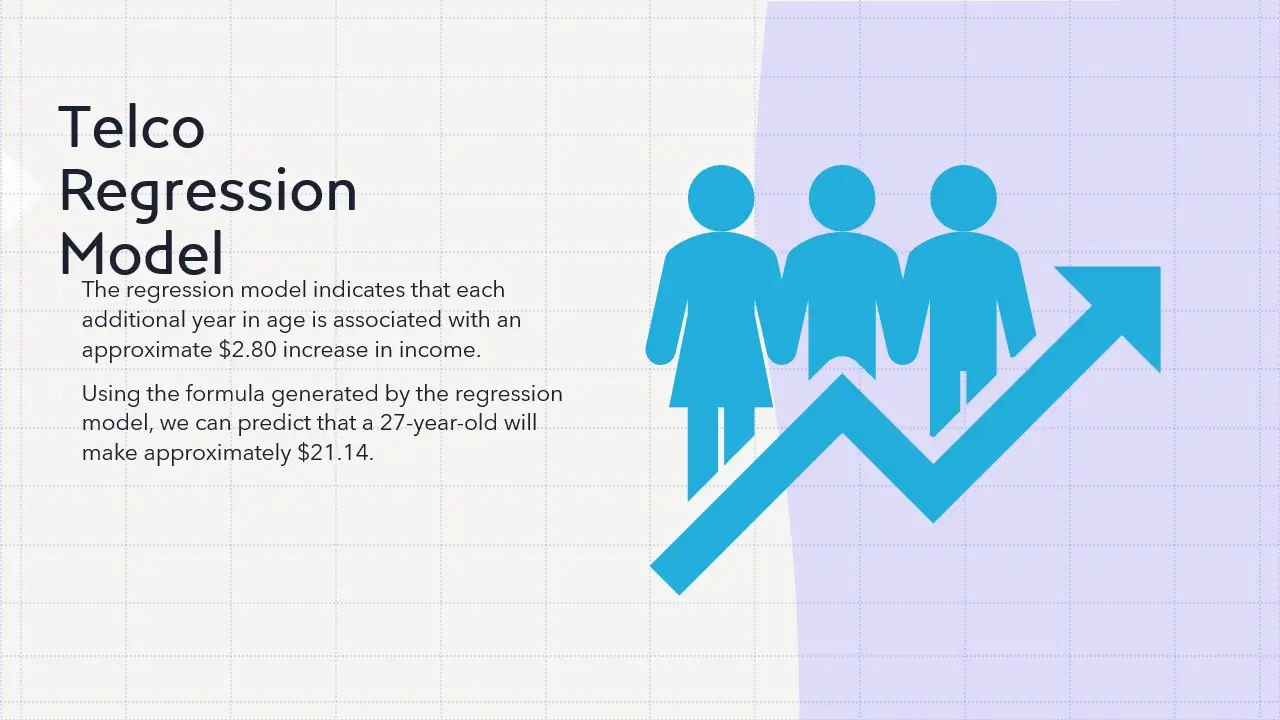
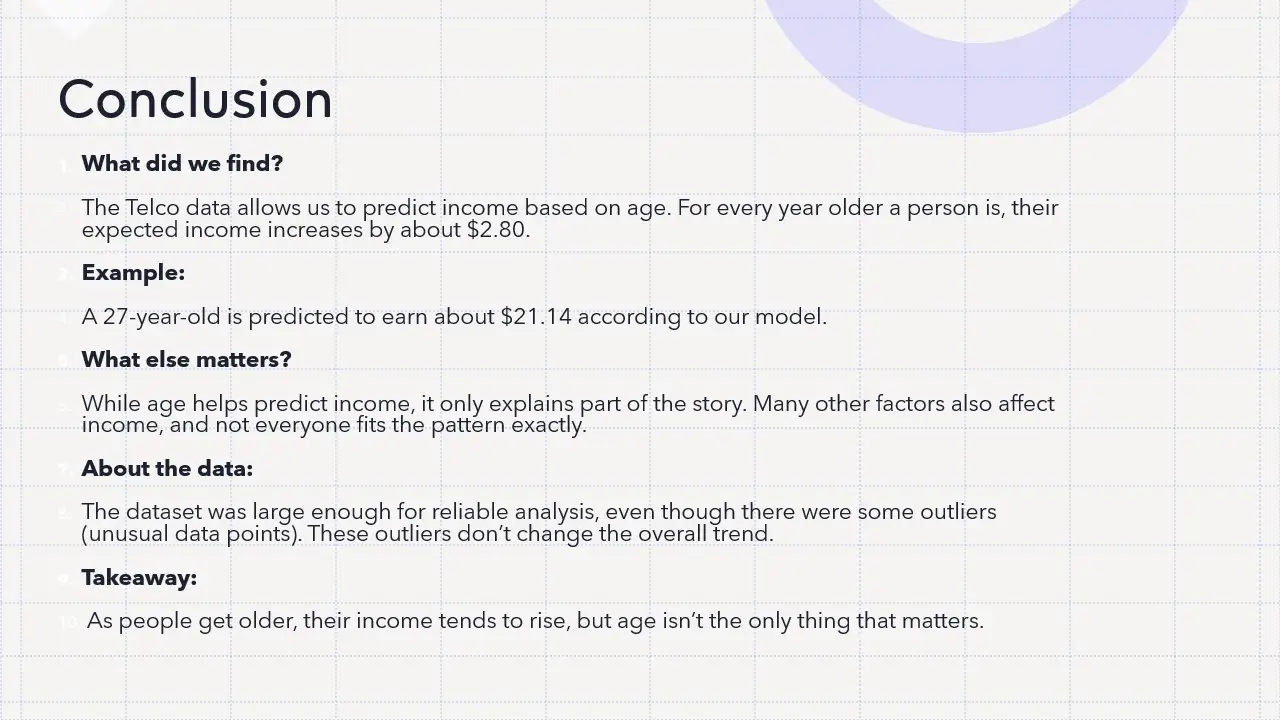
Regression results showed that each additional year of age was associated with an average income increase of about $2.80, with the model predicting that a 27-year-old would earn approximately $21.14.
While the R² value (0.1075) suggested the model explains around 10% of the income variance, this aligns with realistic human data — where income depends on many factors beyond age alone.
Process
1. Discovery & Analysis
- Defined the research question and identified relevant Telco dataset variables.
- Performed correlation testing to explore relationships and detect potential predictors.
- Evaluated data normality and outliers using diagnostic plots.
2. Implementation
- Utilized SAS procedures for regression and correlation analysis.
- Visualized data through scatter plots, fit plots, and residual diagnostics.
- Interpreted statistical outputs (p-values, R², residuals) in business terms.
3. Results & Optimization
- Summarized key findings through visual storytelling in PowerPoint.
- Applied critical review to improve clarity and annotation of plots.
- Reflected on the importance of model limitations in real-world decision-making.
Key Deliverables
- Correlation & Association Analysis: Identified a moderate positive correlation between age and income.
- Regression Model Visualization: Developed a fit plot and diagnostics illustrating model strength and limitations.
- Interpretation Report: Explained statistical findings in accessible business language suitable for executive presentation.
Lessons Learned
This project strengthened my understanding of:
- Translating statistical results into business insights.
- The impact of outliers and sample size on model accuracy.
- The importance of communicating uncertainty and assumption testing in regression analysis.
It also reinforced the idea that data-driven storytelling is as vital as technical accuracy — an approach I continue to carry into all of my analytics work.
Modern Enhancements
If I were to revisit this analysis today, I would replicate it using R or Python, leveraging libraries such as ggplot2, tidyverse, or scikit-learn to enhance reproducibility, scalability, and visualization quality. R’s statistical modeling capabilities provide elegant diagnostics and smoother integration with data visualization workflows, while Python’s automation and API versatility make it ideal for integrating regression analysis into dashboards or workflow pipelines. These tools allow for deeper exploratory data analysis and more dynamic presentation of results — capabilities that align with how modern analytics now merges programming, automation, and storytelling.
AI Feasibility Reflection
While AI tools can automate portions of regression analysis — from data cleaning to visualization — they still require human direction to ensure relevance, accuracy, and ethical interpretation. I view AI not as a replacement, but as a collaborative assistant that accelerates data workflows while amplifying human creativity.
For this project, an AI agent could replicate the calculations in seconds, but it would not understand why age is an important socioeconomic factor, or how outliers can reshape interpretation. The human role lies in asking better questions, defining meaningful parameters, and validating results against real-world logic.
Ultimately, AI and analysts thrive in partnership: the machine generates possibilities; the human provides purpose. Knowing the core principles of analysis — and having the empathy to apply them responsibly — ensures that I remain the architect, not the artifact, of my work.
Technical Details
For illustration purposes, a simplified version of the analytical logic is shown below:
| |
Visual Summary
Key slides from the analysis:
Click through the slideshow below:
Conclusion
This regression study demonstrates how even simple linear models can uncover meaningful trends when approached with statistical rigor and transparency.
Age may not explain all variations in income — but analyzing its influence provides a foundation for deeper multivariate models that incorporate experience, education, and socioeconomic factors.